The welfare state is not just the state of our country, but the people who live in it and several actual states. Many people rely upon these benefits for good reason (disabled, elderly, children, etc.) and no one argues that point. Welfare has spiked the last five years unlike any other time in the history of our country. Not only are large amounts of people on it, but the duration and amount being received have gotten excessive. For many, it has become a way of life, not just a helping hand in a time of need. This is the state of welfare, as we now know it.
 Unemployment spiked in 2008 due to the financial and housing meltdown.
Five years later, we still have high unemployment and much more debt to boot. Government reporting standards have changed in order to sugar coat the real numbers, especially under President Obama. The true measure of unemployment is the U6 measure; it is defined as:
Thus, it accounts for the unemployed and under employed. This measure still has our unemployment rate at 13.2% today as opposed to the 7% being reported by the administration.
 Welfare pays out too much, taking away the incentive to find a job.
A
2012 report highlighted how people on welfare are now taking in more than the median household in America. Why work if you can live better than the median family in America?
+Walt Armour may have summarized this situation better than anyone,
he stated:
Based on data from the Congressional Research Service, cumulative spending on means-tested federal welfare programs, if converted into cash, would equal $167.65 per day per household living below the poverty level. By comparison, the median household income in 2011 of $50,054 equals $137.13 per day. Additionally, spending on federal welfare benefits, if converted into cash payments, equals enough to provide $30.60 per hour, 40 hours per week, to each household living below poverty. The median household hourly wage is $25.03. After accounting for federal taxes, the median hourly wage drops to between $21.50 and $23.45, depending on a household’s deductions and filing status. State and local taxes further reduce the median household’s hourly earnings. By contrast, welfare benefits are not taxed.
SNAP is one form of welfare given out by the states. It is meant to supplement people's incomes for food.
An analysis shows that the average individual received $133.08 in monthly welfare from the program for 2013. In 2009, this amount was $125.31; an increase of 6% over that time. A family of four, on SNAP welfare, would receive
$532.32 per month! This program is meant to SUPPLEMENT people's income, not pay entirely for their grocery bill. At $0.39 per Ramen noodle container, it would cost approximately $140.40 to feed a family of four, three meals a day. So, it is not like people are going to starve on this amount. SNAP is just one of the many welfare programs, keep in mind.
During this same time period, the Consumer Price Index, which measures inflation in goods and services
rose 7.97%. The numbers are below, for those who will argue inflation the rest of this article:
Series Id: SUUR0000SA0
Not Seasonally Adjusted
Area: U.S. city average
Item: All items
Base Period: DECEMBER 1999=100
Year
|
Jan
|
Feb
|
Mar
|
Apr
|
May
|
Jun
|
Jul
|
Aug
|
Sep
|
Oct
|
Nov
|
Dec
|
Annual
|
|---|
2009
|
122.095
|
122.598
|
122.803
|
123.053
|
123.427
|
124.485
|
124.293
|
124.620
|
124.706
|
124.791
|
124.788
|
124.544
|
123.850
|
|---|
2010
|
124.987
|
124.972
|
125.442
|
125.620
|
125.678
|
125.521
|
125.536
|
125.756
|
125.830
|
125.969
|
125.920
|
126.143
|
125.615
|
|---|
2011
|
126.778
|
127.363
|
128.585
|
129.483
|
129.999
|
129.846
|
129.983
|
130.351
|
130.635
|
130.373
|
130.196
|
129.844
|
129.453
|
|---|
2012
|
130.363(U)
|
130.829(U)
|
131.649(U)
|
131.993(U)
|
131.902(U)
|
131.819(U)
|
131.614(U)
|
132.203(U)
|
132.702(U)
|
132.699(U)
|
132.212(U)
|
131.896(U)
|
131.823(U)
|
|---|
2013
|
132.272(I)
|
133.188(I)
|
133.506(I)
|
133.430(I)
|
133.652(I)
|
133.925(I)
|
133.944(I)
|
134.086(I)
|
134.257(I)
|
133.964(I)
|
133.724(I)
| | |
|---|
U : InterimI : Initial
|
As previously discussed in
BASE-LESS…BOEHNER SHOWS HIS TRUE STRIPES, the AVERAGE tax bill for the lower 47% of income earners is -9.1%. Most people would love a 9% bonus annually on tax day. This welfare system is what we call our current tax code. It steals from the top and gives to the bottom.
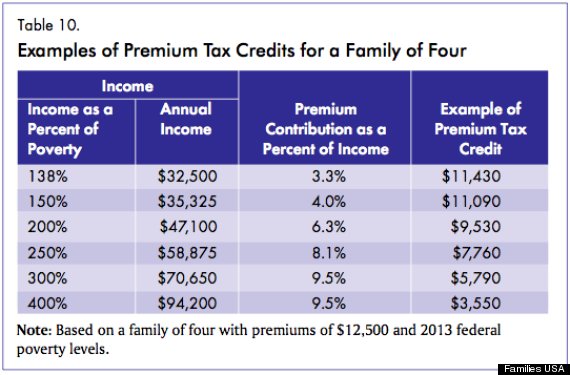
 In 2014, Obamacare will further the welfare tax laws to benefit the bottom 47%, yet again.
The 9% refund, previously discussed, is before these credits begin in our tax law. Much of the discussion, thus far, is prior to this monstrosity being in full effect. Statistics will show, after 2014, the massive wealth redistribution and welfare program we are now running.
Families USA, a liberal organization, charted the welfare package included in Obamacare. The known part of this welfare package is enormous. And, keep in mind, no one knows all the impacts of this legislation as of yet. We only know the general outcomes from common sense and what is already known.
 One cannot possibly cover all the welfare programs in a single article.
After all, the state of our welfare system has grown to epic proportions and programs. Much like Obamacare, we just didn't know what was in it until we read it. The charges that Republicans or any other group seeking to reduce spending on welfare programs is simply crap. These programs provide more than just an assist; they are a way of life. With the recent economic downturn, it will not be surprising to see many maintain their lifestyle on welfare. Welfare is just like feeding the animals at the zoo; once they taste it, they are addicted and will come back.